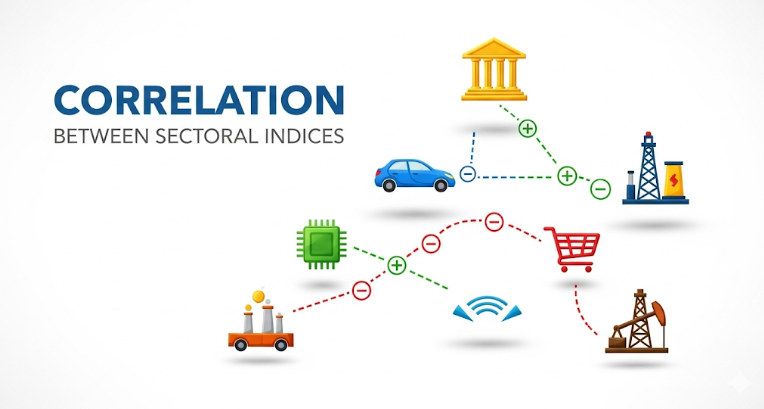
Correlation Between Sectoral Indices | 2025 Trader’s Guide
The correlation between sectoral indices in India reveals how Banking, IT, Pharma, Auto, and other indices move together. For traders, understanding these relationships is key to portfolio diversification, hedging, and timing trades. This guide by Trading Shastra explains sectoral correlation, real examples, and strategies for navigating the Indian market in 2025.
What Are Sectoral Indices in India?
Sectoral indices are benchmarks representing performance of specific industries in the stock market. In India, NSE and BSE publish major sectoral indices such as:
Nifty Bank – Performance of banking stocks.
Nifty IT – Tech companies like Infosys, TCS, Wipro.
Nifty Pharma – Pharma and healthcare sector.
Nifty Auto – Automobile manufacturers.
Nifty FMCG – Consumer goods companies.
Each index represents the health of its sector. But when combined, their correlation tells us how sectors impact each other and the overall market.
Why Correlation Between Sectoral Indices Matters
Traders often ask: why should I care about sector correlations?
Because:
Diversification: If Bank and IT indices are highly correlated, holding both won’t reduce risk much.
Hedging: Negative correlation helps traders balance portfolios.
Sector Rotation: Helps identify when money is moving from one sector to another.
Macro Analysis: Shows broader market cycles.
👉 As Investopedia notes, correlation is a powerful tool for risk management.
Positive vs Negative Correlation Explained
Positive Correlation: Indices move in the same direction. Example: Nifty Bank and Nifty Financial Services often rise together.
Negative Correlation: Indices move in opposite directions. Example: Nifty Pharma often rises during market stress while Nifty Bank falls.
Low/No Correlation: Indices move independently. Example: Nifty IT and Nifty Auto may not always align.
Real Examples of Correlation in India
Nifty Bank & Nifty Financial Services
Both track financial institutions. Their correlation is usually above 0.85, meaning they rise and fall together.Nifty IT & Nasdaq
Because most IT companies earn in USD, their correlation with global tech indices is strong. A Nasdaq drop often pressures Nifty IT.Nifty Pharma During Covid-19
While Nifty Bank collapsed in March 2020, Pharma surged. This is a classic negative correlation event.Nifty Auto & Nifty Energy
Auto and energy often move in sync because fuel costs directly impact automobile demand.
Impact on Trading Strategies
Understanding the correlation between sectoral indices can:
Improve Hedging: Pair longs in one index with shorts in another.
Enable Pairs Trading: Trade two highly correlated indices for arbitrage.
Guide Sector Rotation: Shift capital into sectors outperforming while exiting correlated laggards.
Support Options Strategies: Hedge with negatively correlated sectors.
At Trading Shastra Academy, we train students to combine sectoral correlation with options hedging to create adaptive strategies.
How to Track Sectoral Correlation in India
Use NSE/BSE sector index charts.
Platforms like TradingView.
Statistical tools: correlation coefficients, regression models.
Live FII-DII flow to see money shifts between sectors.
Case Study: Sector Correlation in 2022
In 2022, rising interest rates hurt the IT index but boosted Nifty Bank. Traders who understood negative correlation between these sectors successfully rotated capital, gaining on one side while avoiding losses on the other.
Why Learn This at Trading Shastra?
Most academies teach “theory.” At Trading Shastra Academy, Noida, we go deeper:
Live Correlation Tracking: Students monitor NSE sector moves in real-time.
Funded Programs: With ₹10–50 Lakh allocations, you apply correlation strategies with real money.
Risk-Free Learning: 100% loss coverage, algo support, and NISM prep.
Unique Teaching Style: Using mythological parallels for decision-making discipline.
👉 Already part of our offline trading courses in Delhi NCR.
FAQs
Q1: What is correlation between sectoral indices?
A: It measures how two or more sector indices move relative to each other.
Q2: Which are the major sectoral indices in India?
A: Nifty Bank, IT, Pharma, Auto, FMCG, Energy.
Q3: Why does sector correlation matter for traders?
A: It helps with diversification, hedging, and sector rotation strategies.
Q4: How do Nifty Bank and Nifty IT correlate?
A: Usually low or negative; rising interest rates hurt IT but help Banks.
Q5: Can correlation help in hedging?
A: Yes, traders often hedge long positions with negatively correlated sectors.
Q6: What is negative correlation between indices?
A: When one sector rises while another falls.
Q7: How did Pharma behave during Covid?
A: Pharma surged while Bank and Auto indices crashed.
Q8: How can investors track correlation?
A: Via NSE/BSE data, TradingView, and correlation calculators.
Q9: Is correlation always reliable?
A: No, correlations can shift with macroeconomic changes.
Q10: Do trading academies teach correlation strategies?
A: Yes, Trading Shastra integrates correlation with hedging and arbitrage.
See Our More Blogs
Institute Info
Trading Shastra Academy
B-11, Sector 2, Noida – 201301
Website: www.tradingshastra.com
Email: info@tradingshastra.com
Phone: +91 9717333285
Disclaimer
This blog is for educational purposes only. Stock market investments are subject to risks. Please do thorough research before investing.
