Bollinger Bands Strategies — Complete Trading Guide 2025
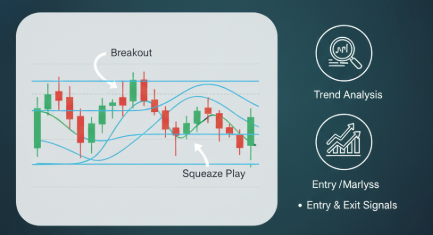
Example: Bollinger Bands squeeze leading to a breakout (illustrative).
What Are Bollinger Bands?
Bollinger Bands are a volatility indicator consisting of a center moving average (typically a 20-period simple moving average) and two outer bands plotted at ±2 standard deviations. The bands widen during high volatility and contract during calm markets. Many traders ask about Bollinger Bands strategies because the indicator visually shows when price is compressed (a “squeeze”) or extended — two setups traders exploit for entries and exits.
The calculation is straightforward: middle band = 20-period SMA; upper band = SMA + (2 × standard deviation); lower band = SMA − (2 × standard deviation). Because these bands are volume-agnostic, pairing Bollinger Bands with volume-based tools (VWAP, volume spikes) or momentum indicators (RSI) increases signal reliability.
How Bollinger Bands Work
Bollinger Bands respond to price volatility: band contraction (a squeeze) suggests low volatility and an imminent expansion; band expansion follows big moves. Many profitable Bollinger Bands strategies use band width and price action to decide whether to trade breakouts or mean reversion. When the price hugs the upper band with rising RSI, momentum often continues; when price rides the lower band with oversold RSI, mean reversion setups become attractive.
A common interpretation: ~90% of price action occurs within the bands, so persistent closes outside a band can signal acceleration rather than immediate reversal. Context is key — combining bands with volume confirms institutional participation in the move.
Popular Bollinger Bands Strategies
1) The Squeeze & Breakout
The squeeze is the basis of many breakout-style Bollinger Bands strategies. When bands compress, volatility has contracted — a significant directional move often follows. Entry: trade the breakout when price closes beyond the upper/lower band with volume above average (e.g., 1.5–2x recent volume). Stop: just inside the bands or back below the breakout candle low. Target: measured move using prior range or ATR multiples.
2) Mean Reversion (Band Fade)
Band fade trades the tendency of price to return to the SMA. If price touches the upper band but RSI is not extreme and volume is low, consider shorting toward the middle band. For longs, look for lower-band touches with bullish divergence on indicators. Risk management is vital: use tight stops beyond the band extremes because strong trends can keep price outside bands.
3) Trend-Follow with Band Riding
In strong trends, price may “ride” the band (staying near the upper band in uptrends). A trend-follow Bollinger setup buys pullbacks that remain above the middle SMA and use the band as a trailing stop. This style of Bollinger Bands strategies is best combined with volume confirmation and higher-timeframe trend checks.
Bollinger Bands vs Other Indicators
Bollinger Bands are volatility-sensitive, while indicators like RSI measure momentum and moving averages show trend. Using them together improves signal quality. For instance, a squeeze breakout with rising RSI and volume is a stronger trade than a breakout on price alone — this combo is a core element of many robust Bollinger Bands strategies.
| Indicator | Primary signal | Best use |
|---|---|---|
| Bollinger Bands | Volatility squeeze/expansion | Intraday & swing setups |
| RSI | Momentum & divergence | Confirming entries |
| VWAP | Institutional fair value | Execution & bias |
The tables above compare Bollinger Bands with momentum and execution tools. Use bands to spot volatility regimes, RSI to confirm momentum, and VWAP to align with institutional flow. Together these elements comprise a toolkit for many effective Bollinger Bands strategies — squeeze breakouts for momentum traders, band fades for mean-reversion traders, and band-riding rules for trend followers.
Benefits of Bollinger Bands Strategies
Bollinger Bands strategies provide dynamic levels that adjust to volatility, help identify squeezes that lead to strong moves, and offer clear rules for mean reversion and breakout trades. They are easy to visualize and combine well with volume, RSI, and VWAP to create a multi-confirmation approach. For intraday traders, bands deliver quick signals; for swing traders, anchored or multi-timeframe band analysis identifies entry zones and stop placement. When risk-managed correctly, band-based strategies improve trade clarity and remove guesswork.
Risks & Limitations
Like any tool, Bollinger Bands strategies can produce false signals, especially during low-volume sessions or choppy markets where price oscillates and creates whipsaws. Band fades can be dangerous in trending markets where price stays outside the band for extended periods. Overfitting parameters (e.g., non-standard SMA length) can deteriorate performance. Use strict position sizing, define stops beyond band extremes, and combine bands with other indicators to reduce false entries.
Step-by-Step: How to Trade with Bollinger Bands
- Choose timeframe (5m/15m for intraday; 1h/daily for swing) and set 20-period SMA ±2 std dev.
- Identify regime: squeeze (low width) vs expansion (wide bands).
- For breakouts: wait for close beyond band + volume confirmation (1.5–2x typical volume).
- For fades: confirm divergence or low momentum before fading the band touch.
- Set stop beyond band extreme and target middle band or measured moves; size positions conservatively.
How Trading Shastra Teaches Bollinger Bands
At Trading Shastra Academy, our Bollinger modules combine live chart drills, strategy backtests, and internship-style practice. Students learn multiple Bollinger Bands strategies: squeezes, fades, band riding, and anchored band concepts. Course graduates receive internship certification and access to mentor-led sessions where trades are executed in demo/funded environments. If you want practical band-based setups plus risk controls, see our programs and scheduled live cohorts.
If you’re exploring related topics, check our bullish option strategies guide for combining bands with options plays.
Frequently Asked Questions
What are the default Bollinger Bands settings?
Default is 20-period SMA with bands at ±2 standard deviations. Traders may adjust length or deviation for different securities, but defaults work well across many instruments.
Which timeframe is best for Bollinger Bands strategies?
It depends: 5m–15m works for intraday squeezes and breakouts; 1h–daily suits swing setups and anchored band analysis. Match timeframe to your trading horizon and risk tolerance.
How do I avoid false breakouts?
Use volume confirmation (1.5–2x usual volume), check RSI for momentum, and prefer breakouts during high-participation hours. Tight stops and sensible position sizing limit damage from fakeouts.
Can Bollinger Bands be used for options trading?
Yes — bands help time entry/expiry for volatility-based options strategies. Combine bands with implied volatility analysis to choose strikes and expiry aligned with expected expansion or reversion.
Are Bollinger Bands reliable in Indian markets?
They work well on liquid securities (Nifty 50, liquid large-caps). Use exchange data and watch for low-liquidity names. For rules and market data, refer to NSE resources.
Want hands-on practice with Bollinger Bands strategies? Join Trading Shastra Academy for live labs, backtesting sessions, and internship certification.
Explore Bollinger Course