RSI Divergence: Powerful Reversal Signal for Traders 2025
Quick Answer: RSI divergence occurs when price makes a new high or low but the RSI indicator fails to confirm the move. This signals a possible trend reversal. Traders use bullish RSI divergence to spot upward reversals and bearish RSI divergence to catch downward reversals before they become obvious.
Introduction
Technical analysis offers many signals, but few are as reliable as RSI divergence. The Relative Strength Index (RSI) is a momentum oscillator that tracks the speed of price movements. When its readings diverge from actual price action, it can reveal hidden shifts in market sentiment. In this guide, we’ll explain what RSI divergence is, the difference between bullish and bearish setups, how to trade it, and why it’s considered one of the most powerful reversal signals for traders in 2025.
What is RSI Divergence?
RSI divergence occurs when price and the RSI indicator move in opposite directions. Normally, RSI moves in line with price. But when price continues to make higher highs while RSI makes lower highs—or vice versa— it signals weakening momentum and a possible reversal.
This discrepancy between price and momentum often acts as an early warning system for traders, allowing them to prepare for potential reversals before they’re visible on the charts.
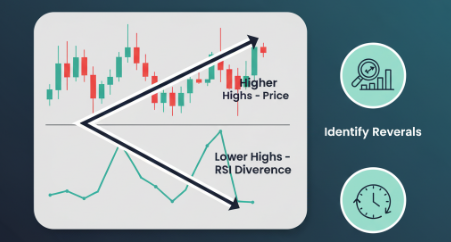
Types of RSI Divergence
- Bullish Divergence: Price makes lower lows while RSI makes higher lows. Signals a potential upside reversal.
- Bearish Divergence: Price makes higher highs while RSI makes lower highs. Indicates possible downward reversal.
- Hidden Divergence: Appears during trend continuation—used to confirm the strength of ongoing trends.
RSI Divergence Examples
Imagine Nifty 50 moving from 20,000 to 20,500 while RSI falls from 70 to 65. This bearish divergence suggests that momentum is not supporting the new high, increasing the chance of reversal. Conversely, if Nifty makes new lows but RSI climbs, it signals bullish divergence and a likely recovery rally.
How to Trade RSI Divergence
- Identify divergence between price and RSI.
- Confirm with candlestick patterns or support/resistance levels.
- Enter position after confirmation (e.g., bullish candle after bullish divergence).
- Set stop-loss below recent swing low for bullish trades, or above swing high for bearish trades.
- Target key support/resistance or use risk-reward ratio (1:2 or better).
Benefits of Using RSI Divergence
- 🔑 Early detection of potential reversals.
- 📉 Helps avoid chasing overextended price moves.
- 📊 Works across multiple timeframes (intraday, swing, positional).
- ⚡ Enhances accuracy when combined with support/resistance and candlestick analysis.
Risks & Limitations
- ❌ False signals in strong trending markets.
- ⏳ Divergences may take time to play out, requiring patience.
- ⚠️ Works best when combined with other technical tools.
Learn RSI Divergence with Trading Shastra Academy
At Trading Shastra Academy, we specialize in teaching powerful reversal signals like RSI divergence. Our live market mentorship, internship certification, and capital-backed programs ensure students not only learn theory but also apply it in real-world markets. From intraday to options strategies, you’ll gain practical knowledge that prepares you for consistent success.
🚀 Enroll NowFrequently Asked Questions
What is RSI divergence in simple terms?
It’s when price makes a new high/low but RSI doesn’t confirm, signaling momentum loss and possible reversal.
Which is stronger—bullish or bearish RSI divergence?
Both are powerful. Bullish divergence works well in oversold zones, while bearish divergence is strong in overbought conditions.
Can RSI divergence be used for intraday trading?
Yes. Intraday traders often use 5–15 min charts to catch short-term reversals with RSI divergence.
Is RSI divergence accurate for all stocks?
It works best in liquid stocks and indices where volume supports technical signals. Avoid illiquid small caps.
📢 Share this guide with fellow traders: