How to Read a Candlestick Chart | 2025 Complete Guide
How to read a candlestick chart is a skill every trader must master. These charts show price action in simple visual form, highlighting whether buyers or sellers dominate. In this guide, Trading Shastra explains candlestick basics, bullish and bearish patterns, and practical examples so beginners can confidently trade in India’s stock market.
What is a Candlestick Chart?
A candlestick chart is a type of financial chart used to show price movement of a stock or index. It was first developed by Japanese rice traders centuries ago and is now the backbone of modern technical analysis.
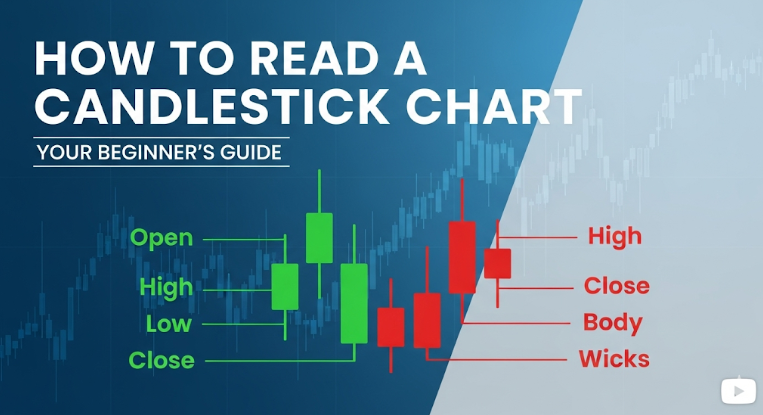
Each candlestick shows four key points:
Open (price when trading started).
High (the highest price in the session).
Low (the lowest price in the session).
Close (price when the session ended).
On platforms like NSE India or TradingView, you’ll see candlesticks colored green (bullish) or red (bearish).
Anatomy of a Candlestick (OHLC)
A single candlestick has three main parts:
Body – The box showing open-to-close movement.
Wicks/Shadows – The thin lines showing highs and lows.
Color – Green/white (close > open = bullish), Red/black (close < open = bearish).
 Understanding this structure is the first step in learning how to read a candlestick chart.
Basic Candlestick Signals
Bullish Candle (Green): Buyers pushed price higher.
Bearish Candle (Red): Sellers dominated the session.
Doji: Open and close nearly equal → market indecision.
Long Wick: Reversal signals when price rejects certain levels.
These basic signals help traders judge momentum quickly.
Popular Candlestick Patterns Every Trader Must Know
Hammer – Appears after a downtrend; long lower wick signals reversal.
Shooting Star – Opposite of hammer, signals bearish reversal.
Doji – Market indecision, often before big moves.
Engulfing Pattern – Strong reversal signal when one candle engulfs the previous.
Morning Star / Evening Star – Multi-candle patterns signaling major trend shifts.
According to Investopedia, these patterns are among the most reliable for traders globally.
How to Read a Candlestick Chart Step by Step
Identify Trend: Are candles making higher highs (bullish) or lower lows (bearish)?
Look for Key Patterns: Spot hammers, dojis, engulfing formations.
Check Volume: Confirm signals with trading volume.
Analyze Timeframe: 5-min for intraday, daily for swing trading.
Confirm with Support/Resistance: Candlestick patterns are stronger near key levels.
Example: If you see a bullish hammer at Nifty’s support zone on BSE India, it may signal a bounce.
Common Mistakes Beginners Make
Over-relying on a single candle without context.
Ignoring volume confirmation.
Trading against the major trend.
Using candlesticks without risk management.
That’s why structured training in candlestick reading is critical.
Why Learn Candlestick Reading at Trading Shastra?
At Trading Shastra Academy, Noida, candlestick analysis is taught not just as theory but with:
Live Market Examples from NSE/BSE.
Mentor Guidance during real trading hours.
Integration with Options Strategies like hedging and arbitrage.
Mythological Teaching Approach – timeless lessons on psychology from Indian epics.
Funded Programs: ₹10–50 Lakh capital, profit sharing, and 100% loss coverage.
Already covered in our offline classes in Delhi NCR.
Practical Example (NSE Stock)
Suppose Infosys stock forms a bullish engulfing pattern after falling for 5 days. A trader reading this correctly can:
Enter a long position.
Place stop-loss at recent low.
Target resistance identified on charts.
This is how reading candlestick charts translates to actionable trades.
FAQs
Q1: What is a candlestick chart?
A: A financial chart showing open, high, low, and close prices for stocks.
Q2: How to read a candlestick chart step by step?
A: Identify trend, spot patterns, confirm with volume, check timeframes, and align with support/resistance.
Q3: What are bullish candlestick patterns?
A: Hammer, bullish engulfing, morning star are common bullish signals.
Q4: What are bearish candlestick patterns?
A: Shooting star, bearish engulfing, evening star show bearish reversals.
Q5: Who invented candlestick charts?
A: Japanese rice traders, later popularized by Steve Nison.
Q6: What is a Doji candlestick?
A: A pattern where open and close prices are nearly the same, showing indecision.
Q7: What is the difference between candlestick and bar chart?
A: Candlesticks show color-coded emotions, bar charts are less visual.
Q8: How to use candlestick charts for intraday trading?
A: Focus on 5-min or 15-min charts with volume confirmation.
Q9: Are candlestick patterns reliable?
A: Yes, when combined with volume and trend analysis.
Q10: Where can I practice reading candlestick charts?
A: Platforms like TradingView and NSE/BSE live charts.
Institute Info
Trading Shastra Academy
B-11, Sector 2, Noida – 201301
Website: www.tradingshastra.com
Email: info@tradingshastra.com
Phone: +91 9717333901
Disclaimer
This blog is for educational purposes only. Stock market investments are subject to risks. Please do thorough research before investing.