M and W Pattern in Trading (2025): Meaning, Identification & Reversal Strategy
What is the M Pattern (Double Top)?
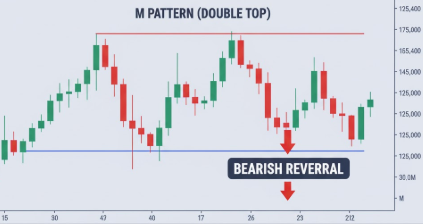
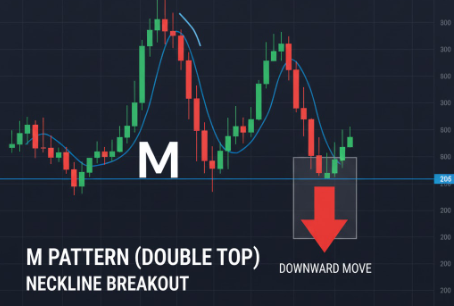
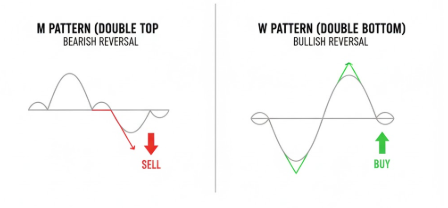
The M pattern, commonly called a double top, forms after a sustained uptrend when price makes two clear peaks at or near a resistance level with a trough (neckline) between them. A decisive close below the neckline usually confirms the pattern and signals a bearish reversal.
Key Identification Rules
- Two peaks: Price forms two distinct highs around the same resistance zone.
- Intervening trough (neckline): A defined swing low separates the peaks.
- Neckline break for confirmation: A daily close below the neckline with increased volume is ideal confirmation.
- Measured target: Project downside target by subtracting the pattern height (peak to neckline) from the neckline break point.
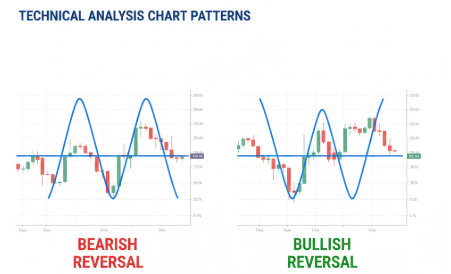
Is the M Pattern Bearish or Bullish?
Short answer: Bearish. The M (double top) reflects exhaustion of upward momentum and a shift to sellers. But false signals exist — always wait for a proper neckline break plus volume/momentum confirmation before trading.
Common False Signals & How to Reduce Them
- Shallow breakouts: Ignore intraday or marginal closes below the neckline without follow-through.
- Low volume: A valid bearish breakout often shows expanding sell volume on the move down.
- Trend context: In very strong bull trends, double tops can fail; verify with higher timeframe structure and momentum indicators.
Practical Trading Rules for M Patterns
- Wait for a daily close below the neckline. Avoid trading on intraday noise.
- Enter on the break or on a retest of the broken neckline (safer entry with better risk-reward).
- Place stop loss above the second peak (or above the retest high).
- Set target using the measured move; trail stops as price moves in your favor.
What is the W Pattern (Double Bottom)?
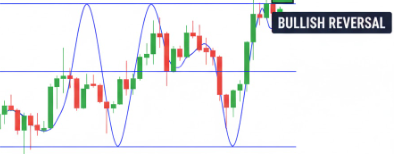
The W pattern, also known as a double bottom, develops after a downtrend when price tests a key support level twice and fails to make a new low. It signals that sellers are losing strength and buyers are preparing for a potential trend reversal.
Once price closes decisively above the neckline — the midpoint between the two bottoms — the pattern confirms a bullish reversal.
How to Identify a W (Double Bottom) Pattern
- Two troughs: Price hits similar lows separated by a small rally.
- Neckline breakout: Confirmation occurs on a breakout above the neckline with higher volume.
- Momentum divergence: The second low often forms with bullish RSI or MACD divergence.
- Target: Add the pattern height (neckline to bottom) to the neckline breakout for projected upside.
Is the W Pattern Bullish?
Yes — the W pattern represents a bullish reversal. Traders use it to spot the beginning of new uptrends or long-term recoveries, especially in Nifty 50 and large-cap stocks in 2025.
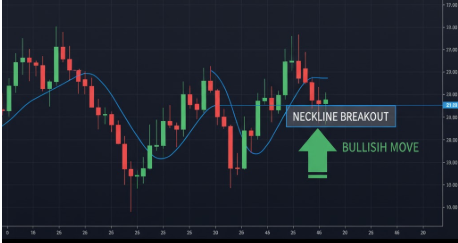
In this example, once the neckline breaks, buying momentum increases and prices often rally to the projected measured-move target. Stop-loss levels are generally placed just below the second bottom for risk protection.
M Pattern vs W Pattern — Key Differences
| Aspect | M Pattern (Double Top) | W Pattern (Double Bottom) |
|---|---|---|
| Market Phase | End of an uptrend | End of a downtrend |
| Signal Type | Bearish reversal | Bullish reversal |
| Neckline Action | Break below support | Break above resistance |
| Volume Behavior | Rising sell volume on break | Rising buy volume on break |
| Ideal Entry | Sell below neckline or on retest | Buy above neckline or on retest |
| Profit Target | Height of pattern below neckline | Height of pattern above neckline |
How to Trade M and W Patterns — Step-by-Step
- Identify the structure: Two highs (M) or two lows (W) on a clear trend.
- Draw neckline: Connect the midpoint between tops or bottoms.
- Wait for confirmation: Trade only after a close beyond the neckline with volume.
- Set risk: Place stop loss above ( M ) or below ( W ) the second swing.
- Define target: Pattern height added to breakout ( W ) or subtracted ( M ).
Learn Pattern Trading with Trading Shastra Academy
Trading Shastra Academy, founded by Himanshu Gurha, teaches students to read and trade patterns like M and W using live market analysis and risk-managed execution strategies.
- Real-time pattern recognition sessions with mentorship.
- Capital-backed training programs with profit sharing and loss coverage.
- Comprehensive modules on technical analysis, psychology and trade management.
FAQs — M and W Pattern Trading
What does the M pattern mean in trading?
The M pattern indicates a bearish reversal after an uptrend — price fails twice at resistance and breaks below its neckline.
What does the W pattern mean?
The W pattern signals a bullish reversal — price tests support twice and then breaks above its neckline with buying volume.
Which pattern is stronger in 2025 markets?
Both are reliable when confirmed, but W patterns often deliver better accuracy in recovery phases of Nifty and Bank Nifty stocks.
Can these patterns be used for options trading?
Yes, especially for directional options strategies. Traders can use bearish M patterns for put entries and bullish W patterns for call entries or bull spreads.
How can I learn pattern trading live?
Join the funded programs at Trading Shastra Academy to learn pattern execution in live markets under professional mentorship.