- Sector -2, B Block Noida-201301
- tradingshastraacademy@gmail.com
Support & Resistance Guide – Complete Strategy for 2025
Introduction
Support and resistance are the foundation of price action trading. Every trader — beginner or seasoned — benefits by understanding how these technical chart levels form and how market psychology creates predictable zones of supply and demand. In this guide you’ll learn what support and resistance mean, step-by-step methods for identifying them, how to draw support and resistance lines cleanly, and trading strategies that use these levels effectively in stocks, forex, and other markets.
What is Support & Resistance?
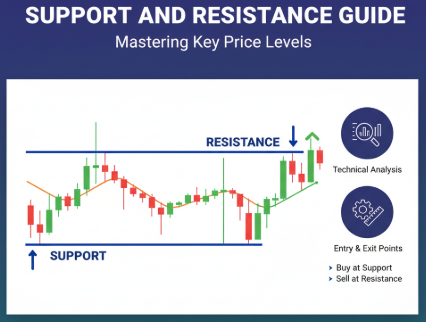
Support and resistance are horizontal or angled levels on a chart where price repeatedly stops and reverses. A support level attracts buyers (demand zone) and stops price from falling further. A resistance level attracts sellers (supply zone) and caps upside. These levels are core to support and resistance in technical analysis because they reflect human behavior — where traders place bids and offers, and where stops cluster.
Think of support and resistance as market memory: previous turning points that traders watch closely. Identifying these technical chart levels helps you plan entries, stops, and targets with higher probability.
How to Identify Support & Resistance Levels
There are several practical ways to find support and resistance: horizontal swing highs/lows, trendlines, moving averages, pivot points and volume clusters. Start with these steps:
- Swing highs & lows: mark recent peaks (resistance) and troughs (support).
- Trendlines: draw lines connecting higher lows in uptrends (support) or lower highs in downtrends (resistance).
- Moving averages: commonly 50/100/200-day EMAs act as dynamic support and resistance.
- Pivot points & Fibonacci levels: use these for intraday and swing levels.
- Volume profile: high volume nodes often act as strong support or resistance because they mark agreed price areas.
Mastering how to draw support and resistance means combining methods — a level confirmed by multiple tools is more reliable.
How to Draw Support & Resistance Lines
Drawing precise lines is a mix of art and rules. Follow a repeatable process:
- Zoom out to the time-frame that matches your trading style (daily for swing, 5–15m for intraday).
- Identify at least two clear touches on the same level (two or more swing highs/lows is ideal).
- Use the candle wicks to mark the outer edge of the level — conservative traders prefer body closes for validation.
- If a level lines up with a moving average or pivot point, increase confidence; mark as a zone rather than a single line.
- Label levels and age them — older, tested levels usually gain strength.
Drawing support and resistance cleanly reduces subjectivity and helps you see breakout vs retest setups clearly.
Support & Resistance Trading Strategies
Once you can identify support and resistance, you can use them in multiple strategies. Here are four practical approaches:
1) Bounce (Range Trade)
Buy near support and sell near resistance inside a clear range. Use tight stop-losses just below support and target the opposite level. This strategy thrives when the market lacks trending momentum.
2) Breakout
Trade breakouts when price closes beyond a strong resistance (or below support). Confirm with volume spike & retest — enter on retest for better risk/reward.
3) Retest Play
After breakout, wait for price to come back and retest the broken level which often turns into support (or resistance). Enter on bullish confirmation signals.
4) Confluence Strategy
Combine support and resistance with moving averages, Fibonacci and volume to create high-probability setups. Confluence reduces false breakouts.
Benefits of Using Support & Resistance
Traders use support and resistance because they provide objective decision points. Key benefits:
- Clear entry and exit structure with defined stops.
- Works on all timeframes and instruments — stocks, forex, commodities.
- Helps avoid emotional entries by relying on price levels and confluence.
- Reduces risk with predictable risk-to-reward planning.
Risks & Limitations
Support and resistance are powerful but not foolproof. Watch for:
- False breakouts (fakeouts) where price briefly breaches a level then reverses.
- Subjectivity — two traders may draw different lines; use zones & confluence to reduce this.
- News-driven moves can invalidate levels quickly; always monitor fundamental context.
- Overfitting — don’t force levels to justify trades; let price confirm them.
Quick Comparison & Example Table
Support vs Resistance at a glance:
| Feature | Support | Resistance |
|---|---|---|
| Price action | Buy pressure | Sell pressure |
| Use | Entry (long) | Exit / short |
| Validation | Multiple touches | Multiple touches |
Example: If Nifty has repeatedly bounced at 17,000, mark 17,000 as support. A breakout above 17,500 with high volume may signal a trend continuation.
Use these tables as a quick reference while you practise drawing support and resistance on charts.
How Trading Shastra Teaches Support & Resistance
At Trading Shastra Academy we focus on practical mastery: live chart sessions, replay analysis, and strategy drills that teach how to draw support and resistance and how to trade retests, breakouts and bounces with real discipline. Our courses include internship certification, mentor feedback, and funded practice accounts to build confidence before you trade your own capital.
If you want structured learning, check our Noida branch programs for detailed syllabi and mentorship options.
Frequently Asked Questions
What is a support level?
A support level is a price area where buying interest exceeds selling pressure, causing price to bounce upward.
How many touches make a level valid?
At least two clear touches are needed; three or more touches increase level strength. Combine with volume or indicators for confirmation.
What is a fakeout?
A fakeout is a false breakout where price briefly violates a level and then reverses. Use retest & volume to avoid fakeouts.
Which timeframe is best?
It depends on your style: daily for positional, 1-hour/15-minute for swing, 5–15m for intraday. Always look for confluence across timeframes.
Can support become resistance?
Yes — after a breakout, the previous resistance often flips to support (and vice versa). This is a core concept when planning entries on retests.
Email: info@tradingshastra.com
Phone: +91 9717333901
This blog is for educational purposes only. Stock market investments are subject to risks. Please do thorough research before investing.