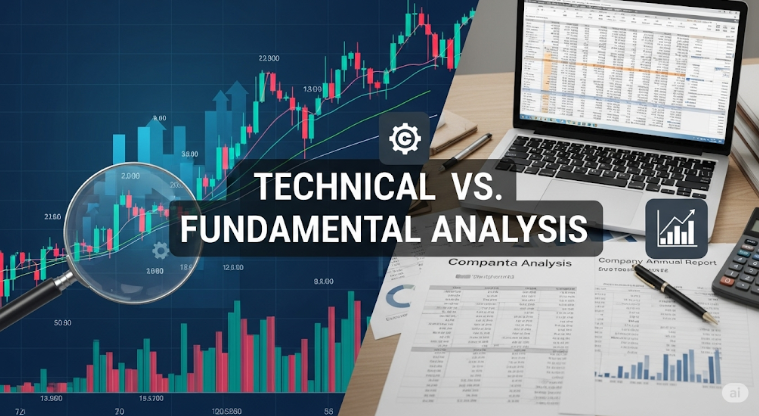
Technical vs Fundamental Analysis | 2025 Complete Guide for Traders
Technical vs. Fundamental Analysis is the biggest debate for stock market traders. Technicals focus on charts and price action, while fundamentals study financial health and company value. In 2025, smart traders in India often combine both methods to maximize returns under NSE/BSE trading and SEBI-compliant frameworks.
Charts or Balance Sheets: The Trader’s Dilemma
Every trader faces this question: Should I trust charts or company fundamentals?
Imagine this: A day trader in Noida sees Nifty forming a bullish breakout on candlesticks (technical analysis), while a long-term investor in Gurgaon checks Infosys’ balance sheet and EPS growth (fundamental analysis). Both are right — but for different time frames.
That’s why knowing the difference between technical and fundamental analysis is critical for anyone serious about trading in 2025.
What is Technical Analysis?
Technical analysis studies price charts, trading volume, and indicators to predict short-term moves.
Tools used: candlesticks, RSI, MACD, moving averages, support & resistance.
Purpose: Identify entry/exit points for trades.
Best for: intraday traders, swing traders, derivatives traders.
👉 Example: If Bank Nifty breaks a resistance level with heavy volume, a technical analyst enters long with a stop-loss below support.
What is Fundamental Analysis?
Fundamental analysis focuses on a company’s financials and long-term value.
Tools used: P/E ratio, EPS, ROE, debt levels, management quality.
Purpose: Estimate intrinsic value of a company.
Best for: investors holding stocks for years.
👉 Example: If TCS reports strong quarterly profits, low debt, and growing market share, a fundamental analyst buys shares for long-term compounding.
Key Differences Between Technical and Fundamental Analysis
| Aspect | Technical Analysis | Fundamental Analysis |
|---|---|---|
| Focus | Price & volume data | Financial statements, economy, ratios |
| Time Horizon | Short-term (minutes to weeks) | Long-term (months to years) |
| Tools | Charts, indicators, trendlines | P/E, EPS, balance sheet, DRHP |
| Best for | Traders (intraday/swing) | Investors (long-term wealth builders) |
| Basis of Decision | Market psychology, chart patterns | Business fundamentals, intrinsic value |
When to Use Technical Analysis
Intraday trading in NSE stocks or Bank Nifty.
Swing trading opportunities in mid-cap stocks.
Timing entries/exits for options and futures.
Confirming momentum with indicators like RSI/MACD.
When to Use Fundamental Analysis
Evaluating IPOs with SEBI-approved DRHP.
Long-term investments in blue-chip companies.
Portfolio building for 5–10 years.
Deciding fair price vs. overvaluation.
Smart Traders Use Both (Hybrid Approach)
In 2025, many successful traders in Delhi NCR use both methods. Example:
A trader uses fundamentals to pick a solid stock (Infosys).
Then applies technicals to time the best entry point.
This combo is SEBI-recommended for risk management because it balances value + timing.
Case Example: Reliance vs. Intraday Nifty Trade
Fundamental Investor: Buys Reliance Industries after analyzing balance sheet, energy projects, and P/E ratio. Holds for 5 years.
Technical Trader: Spots Nifty breakout on charts, enters call option, exits same day with profit.
Both are profitable, but methods differ.
Key Takeaways
Technical vs. Fundamental Analysis = short-term vs long-term focus.
Technical → charts, indicators, quick trades.
Fundamental → financial health, intrinsic value.
Smart approach → combine both for better results.
In 2025, NSE/BSE traders in India are using hybrid analysis models.
FAQs
Q1: What is technical analysis in stock markets?
A: It studies price charts, indicators, and trading volumes to predict market movements.
Q2: What is fundamental analysis in stock markets?
A: It evaluates a company’s financials, P/E, EPS, and growth potential for long-term value.
Q3: Which is better: technical or fundamental analysis?
A: Neither is superior — technical suits traders, fundamental suits investors. Best is combining both.
Q4: Can beginners use technical analysis?
A: Yes, with guidance. Beginners can learn candlestick basics, support-resistance, and momentum indicators.
Q5: How do investors apply fundamental analysis?
A: By analyzing DRHP, quarterly results, ratios, and management commentary before buying shares.
Why Trading Shastra Teaches Both Approaches
At Trading Shastra Academy, led by Himanshu Gurha, we ensure students master both:
Technical skills → candlesticks, indicators, chart setups.
Fundamental skills → balance sheet analysis, valuation methods.
Programs include: ₹10L–₹50L funded capital, 100% loss cover, stipend internships, NISM certification.
Available offline in Noida/Delhi NCR + online across India.
This makes Trading Shastra a one-stop solution for serious traders and investors.
See Our More Blogs
Institute Info
Trading Shastra Academy
B-11, Sector 2, Noida – 201301
Website: www.tradingshastra.com
Email: info@tradingshastra.com
Phone: +91 9717333285
Disclaimer
This blog is for educational purposes only. Stock market investments are subject to risks. Please do thorough research before investing.
