- Sector -2, B Block Noida-201301
- tradingshastraacademy@gmail.com
Long Wick Candle Trading: Why the "Pinocchio" Bar is Your Best Clue Introduction
Let me take you back to a Thursday morning—Bank Nifty expiry day. I vividly remember this trade from my early days, sitting in front of my laptop with a cup of chai that had gone cold. The market opened, and around 9:20 AM, a massive green candle started forming, breaking yesterday’s high. My heart raced. “This is it,” I thought. “If I don’t buy now, I’ll miss the rally.”
Driven by FOMO (Fear Of Missing Out), I punched in a Call Option. For two minutes, I felt like a genius as the price climbed. But with one minute left, the price stalled, slipped, and then crashed. By 9:25 AM, that beautiful green breakout had collapsed into a tiny body with a massive, ugly line sticking out the top. I had just bought the exact top of a Long Wick Candle. That line—often called a “Pinocchio Bar” because it tells a lie about the market direction—was a scream I ignored.
Today, we’re going to master Long Wick Candle Trading so you never get trapped by these “fakeouts” again.
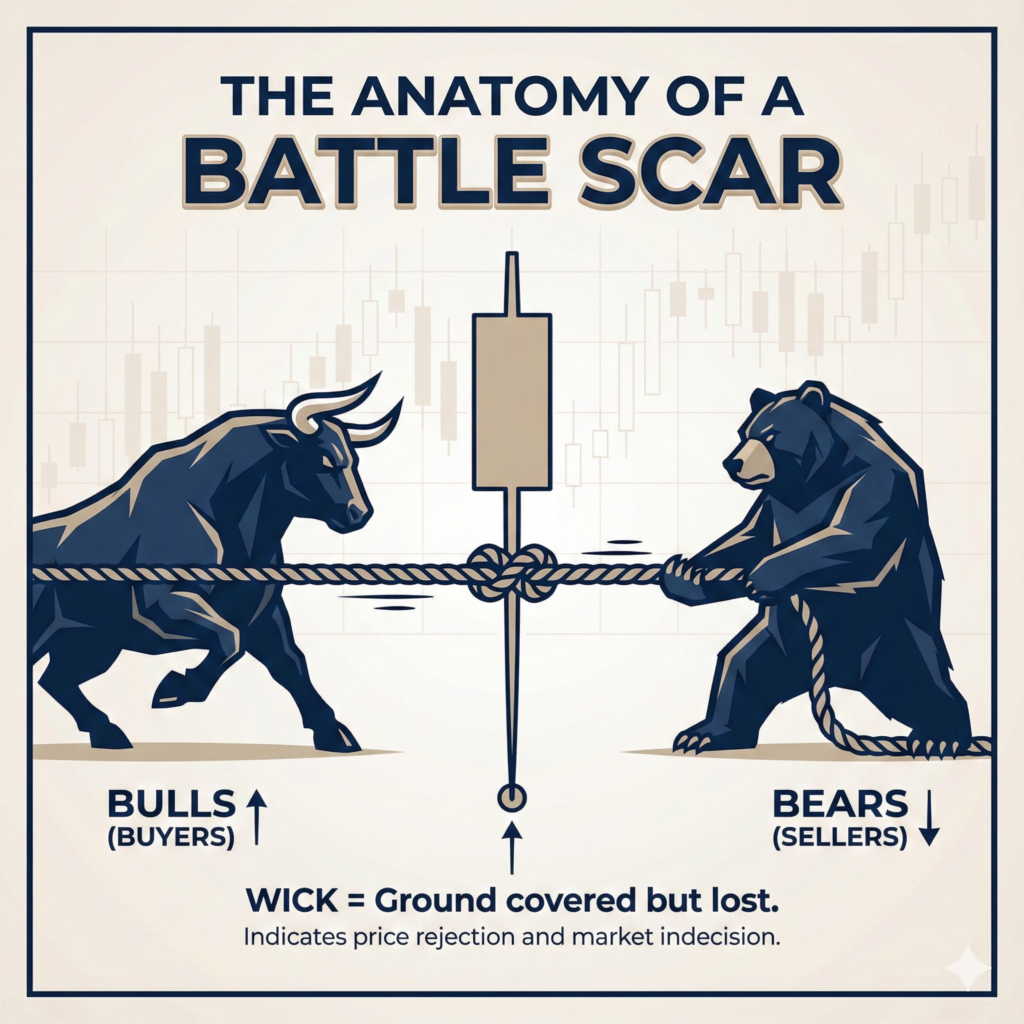
The Anatomy of a "Battle Scar"
To understand a long wick, you have to stop looking at candles as just red and green blocks. You need to see them as a battleground. Every single candlestick tells a story of a war between the Bulls (Buyers) and the Bears (Sellers).
The Body: This is the agreement. It tells you where the price opened and where it settled after the fight.
The Wick (or Shadow): This is the disagreement. This is the battle scar.
Think of a long wick like a rubber band. Imagine the buyers stretching the price higher (creating the wick). But the rubber band gets too tight. The sellers step in, screaming “This price is too expensive!” and snap it back down. The trace left behind is the wick.
The Golden Rule: The longer the wick relative to the body, the stronger the rejection. A tiny wick is a whisper; a long wick is a shout that the market tried to go somewhere, got rejected, and ran back.
Image Suggestion: An infographic showing a tug-of-war rope. One side is labelled “Bulls” and the other “Bears,” with the “Wick” labelled as the ground covered but lost.
The Long Upper Wick: The "Bearish Slap"
Let’s talk about the scenario that trapped me. You see a candle with a small body at the bottom and a very long line sticking up. In technical analysis, we call this a Shooting Star or a Gravestone Doji.
The Psychology Behind It
Here is exactly what is happening inside the heads of traders:
The Trap: The candle starts green. Aggressive retail traders rush in, thinking it’s a breakout.
The Reality Check: As price hits resistance, “Smart Money” (Institutions) sees an opportunity to sell.
The Slap: Huge sell orders hit the market. The buying power dries up, and the price collapses.
A long upper wick is a clear sign of Supply. It means the market rejected higher prices. The Bulls tried to push the door open, but the Bears slammed it shut.
The Long Lower Wick: The "Bullish Save"
Now, flip the script. Imagine a candle with a small body at the top and a long tail hanging down. This is your Hammer or Dragonfly Doji.
I remember tracking Tata Motors recently. Bad news hit, and the stock tanked 3%. Everyone screamed “Sell!” But if you looked closely at the hourly chart, the price would drop, hit support, and bounce back. That scary red drop turned into a long lower wick.
What It Means
The Panic: Sellers dump shares.
The Value Hunt: “Smart Money” steps in, thinking the price is cheap.
The Recovery: Demand overwhelms supply, pushing the price back up.
A long lower wick is a sign of Demand. The Bears tried to dig a hole, but the Bulls pulled them out. If you see a Hammer at a major support zone, it’s often the first sign a reversal is coming.
Context is King: Don't Get Tricked
This is where 90% of beginners mess up Long Wick Candle Trading. They see a wick and immediately trade.
Write this down: A long wick in a sideways, choppy market means nothing.
If the market is stuck in a range (like Bank Nifty often is between 12:00 PM and 1:30 PM), wicks are just noise. The “Pinocchio” nose only matters if it appears at a key location.
The “Real Estate” Rule
Shooting Star (Upper Wick): Only a sell signal at Resistance.
Hammer (Lower Wick): Only a buy signal at Support.
If you see a long wick in the “middle of nowhere” with no support or resistance to the left, ignore it. It’s likely a trap.
Image Suggestion: A chart showing two wicks: one at a resistance line marked “Valid Trade” and one in the middle of a range marked “Trap/Ignore”.
The "Trapped Trader" Theory
Why do these setups work? It comes down to the pain of the Trapped Trader.
Think about the tip of a long upper wick. Who is sitting there? The trader who bought at the absolute highest price. As the candle closes and price drops, they are in a loss. They are “trapped”.
If the next candle moves down, their pain increases. Eventually, they hit “Sell” to save their capital. When they sell, they add more selling pressure, pushing the price down faster. We profit when these trapped traders are forced to puke out their positions.
The Indian Market Special: 9:20 AM Strategy
In the Indian markets (Nifty & Bank Nifty), the 9:15 AM to 9:20 AM candle is notorious for long wicks. This is the Volatility Anomaly.
The 9:20 Straddle & Breakout Failure
Many professionals use a “9:20 Straddle” strategy because they know the initial wicks are often fakeouts. They sell both Call and Put options, expecting the market to stabilize within the range of the first candle’s wicks.
Pro Tip: If the 9:20 AM candle tries to break the high of the 9:15 AM candle (the wick high) but fails and closes back inside, it is a high-probability short signal. This confirms the initial buying wick was a trap.
The "Wick-Off" Checklist
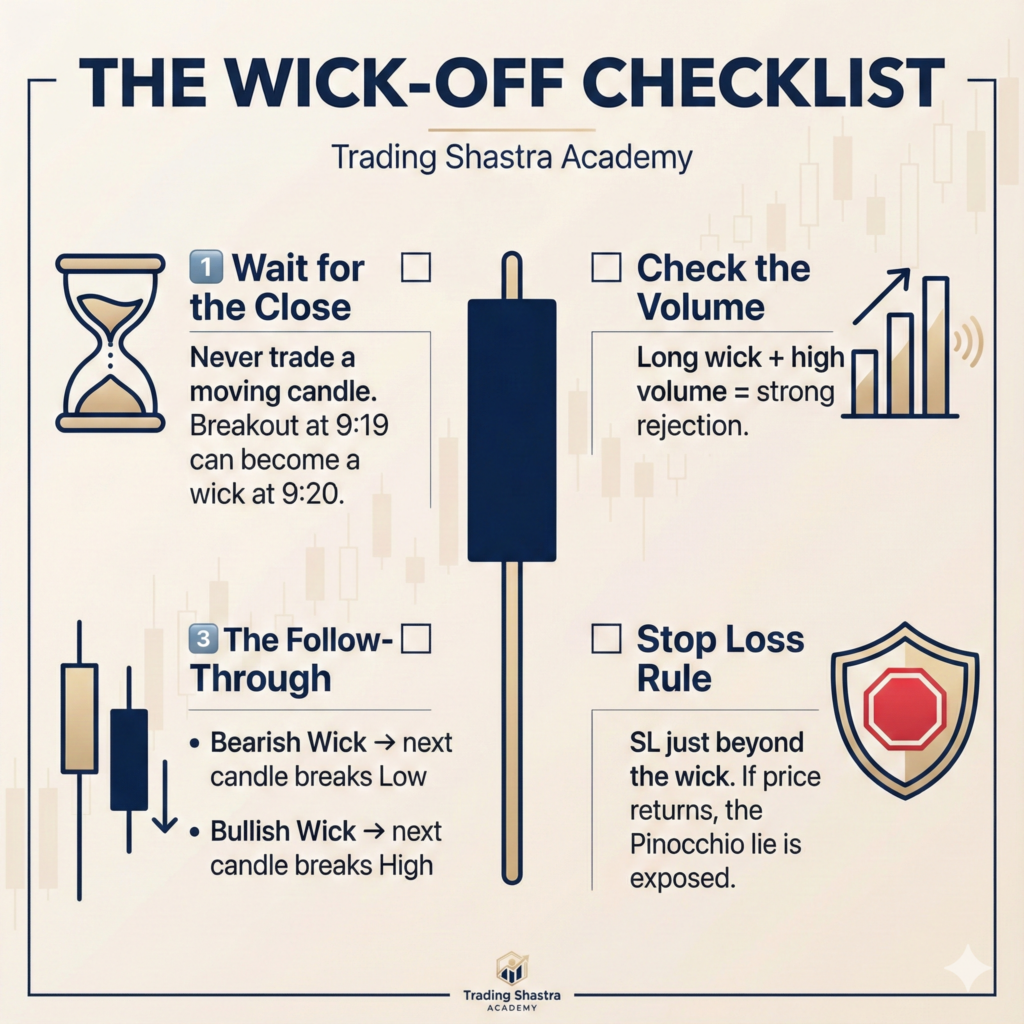
At Trading Shastra Academy, we believe in rules, not gut feelings. Use this checklist for your next Long Wick Candle Trading setup:
Wait for the Close: Never trade a moving candle. It can look like a breakout at 9:19 and a wick at 9:20.
Check the Volume: A long wick with High Volume is golden. It means a huge amount of money changed hands during the rejection.
The Follow-Through:
Bearish Wick: Wait for the next candle to break the Low.
Bullish Wick: Wait for the next candle to break the High.
Stop Loss: Place it just beyond the tip of the wick. If price goes back there, the “Pinocchio” lie has been exposed, and you should get out.
.
Conclusion
Trading isn’t about predicting the future; it’s about listening to the market’s whispers. A long wick is the market saying, “I tried to go there, but I couldn’t.” It is the footprint of a failed attempt and a deception—a “Pinocchio” bar.
Next time you see a long wick on your Nifty chart, don’t panic. Lean back, sip your chai, and ask: “Who is trapped here?” Moving from impulsive reactions to rule-based decisions is your first step to becoming a supreme trader.
Ready to master the markets? Subscribe to our newsletter for daily chart analysis and join our community of disciplined traders today!
Tell us in the comments: Have you ever been trapped by a ‘fakeout’ wick that looked like a breakout?
A wick is generally considered “long” if it is at least 2 to 3 times the length of the candle’s real body. This ratio indicates that the rejection pressure was significantly stronger than the buying or selling intent during that session.
Yes, but higher timeframes (1-Hour, 4-Hour, Daily) are more reliable. Long wicks on 1-minute charts are often just “noise” or minor order flow imbalances, whereas a Daily wick represents a significant rejection of value by major institutions.
The Wick Fill strategy assumes that a wick represents a “path cleared” by price. If a wick forms without strong rejection volume or in the direction of a strong trend, price often returns to “fill” that wick (revisit the high/low) in subsequent candles.
In Indian markets, the 9:15-9:20 AM candle often has long wicks due to opening volatility. The 9:20 strategy involves trading the breakout of this candle’s range or selling a Straddle (both Call and Put) to profit from the volatility crushing as price stays within the wicks.
It is safer to place your Stop Loss slightly beyond the wick tip (buffer of 1-2 ticks or points). This prevents you from getting stopped out by a “Liquidity Sweep” where price briefly pokes the high/low before reversing
The term was coined by Martin Pring. Just like Pinocchio’s nose grew when he lied, a long wick protruding from a candle body suggests the market is “lying” about its direction—it looks like a breakout, but the close reveals it was a fakeout.
Yes. Even if the body is green (closed higher than open), a massive upper wick indicates that buyers lost control of the highs. However, a red body (closed lower than open) on a Shooting Star is a stronger bearish signal.