- Sector -2, B Block Noida-201301
- tradingshastraacademy@gmail.com
Why Your Candlestick Patterns Fail in Live Trading (And How to Fix It) Introduction
It’s a scenario every trader knows too well. You spot a perfect “textbook” Bullish Engulfing pattern on the Bank Nifty 5-minute chart. It looks exactly like the diagrams in the trading books. You enter the trade with confidence, placing your stop loss just below the candle’s low. Then, in the blink of an eye, a massive red candle spikes down, hits your stop loss, and immediately reverses to rocket upwards—leaving you behind.
This isn’t bad luck; it’s a structural reality of modern markets. If you are wondering why candlestick patterns fail in live trading, the answer usually lies not in the pattern itself, but in where and when you are trading it. With recent SEBI reports indicating that over 90% of retail traders in the F&O segment incur losses, it is clear that simply memorizing shapes like Dojis and Hammers is no longer enough to survive against institutional algorithms.
In this guide, we will decode the “Smart Money” mechanics behind these failures and show you how to stop being the liquidity for someone else’s trade.
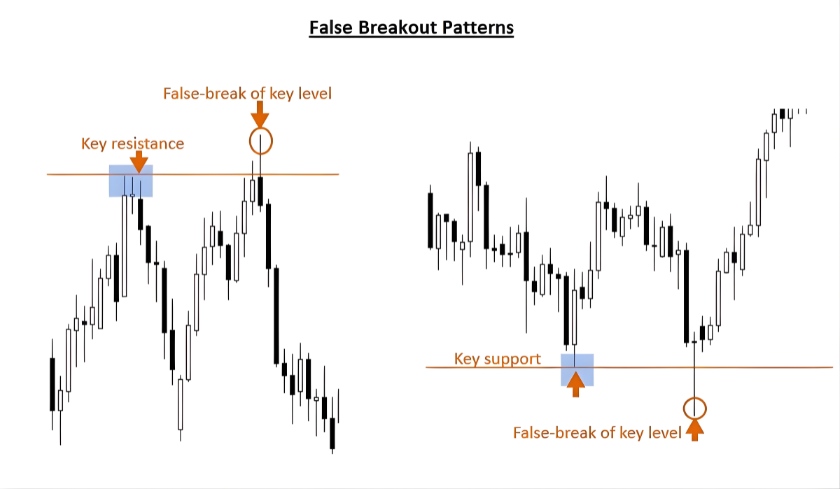
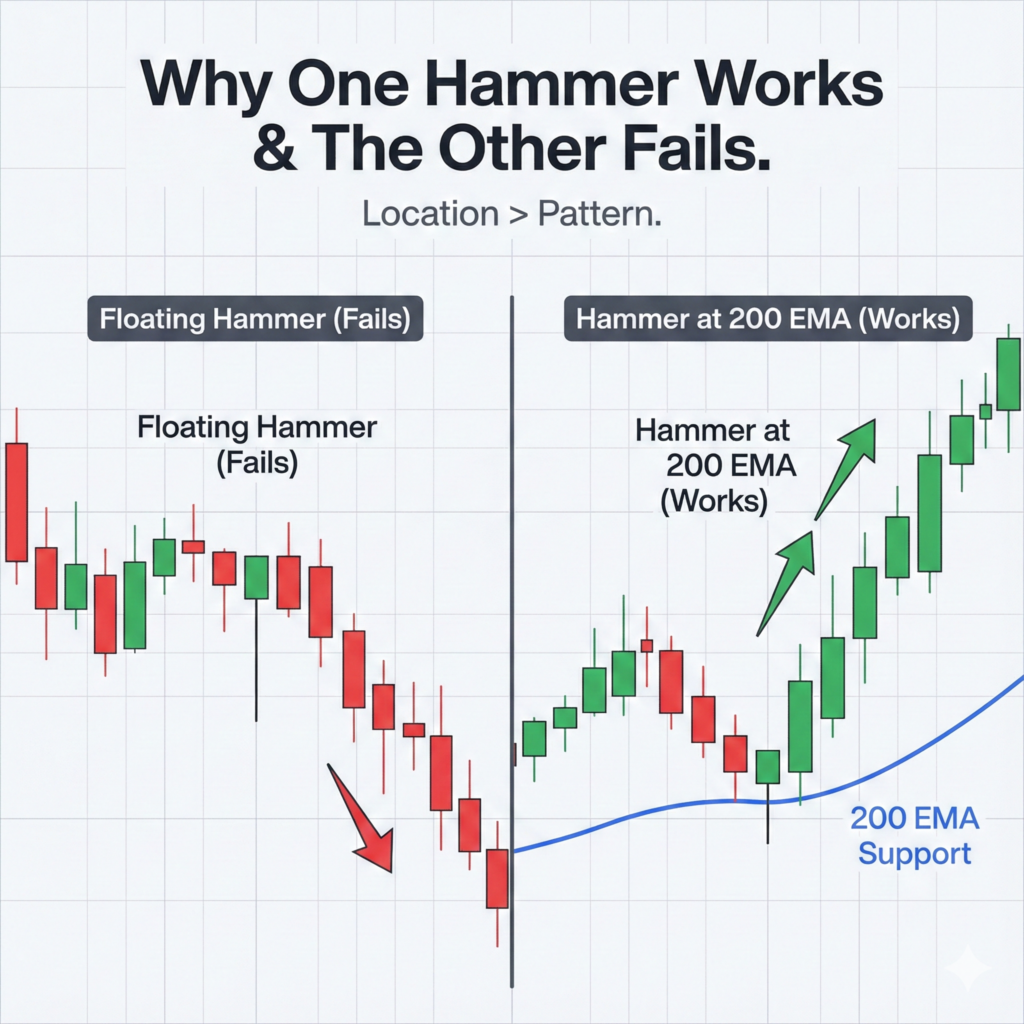
1. The "Floating Pattern" Mistake: Location is Everything
Imagine opening a luxury winter jacket store in the middle of the Thar Desert. The jackets (your patterns) might be high quality, but the location guarantees failure. This is the most common reason why candlestick patterns fail in live trading—traders execute them in “no man’s land.”
A candlestick pattern is merely a tactical signal; it is not a strategy in itself. A Hammer candle indicates rejection of lower prices, but if that Hammer forms in the middle of a sideways range (consolidation), it is meaningless noise.
The S.L.C. Rule
To fix this, you must adopt the S.L.C. hierarchy:
Structure: Is the overall market trend Up or Down?
Location: Is the price at a Key Level (Support, Resistance, or Order Block)?
Candle: Only now do you look for the pattern.
Smart Tip: Use the Central Pivot Range (CPR) indicator. If a bullish pattern forms below the Bottom Central Pivot (BC) or a bearish pattern forms above the Top Central Pivot (TC), the probability of failure is statistically higher because you are trading against the value area.
2. You Are the Liquidity: Understanding Smart Money Traps
This is the hardest pill for retail traders to swallow: Institutional algorithms know exactly where your textbooks told you to put your Stop Loss.
Big players (FIIs/DIIs) cannot just “buy” 50,000 lots of Nifty Futures at once. If they did, slippage would destroy their entry price. They need a massive pool of sell orders to match their buy orders.
Where do they find those sell orders? Right below the obvious “Retail Support” levels where you placed your Stop Loss.
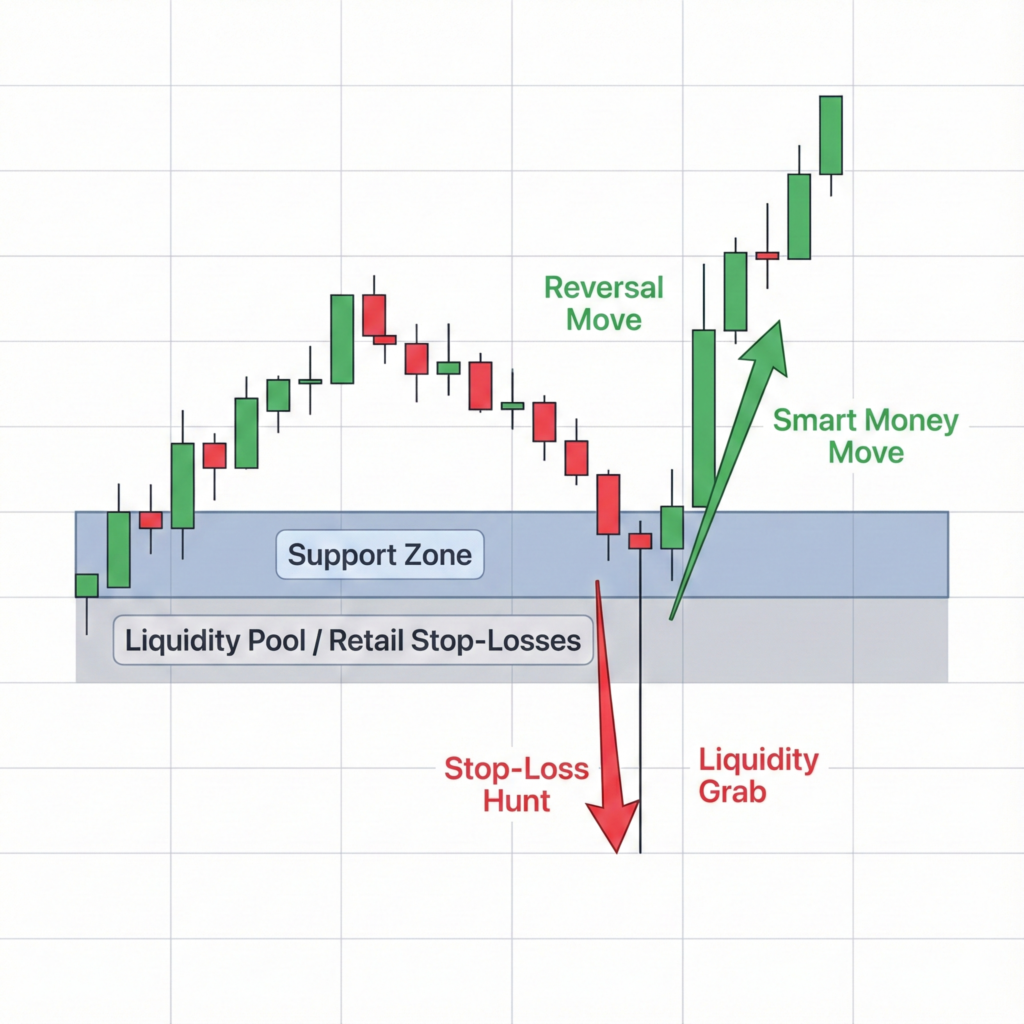
The Anatomy of a Liquidity Grab
The Bait: Price forms a clean “Double Bottom” support. Retail traders buy and place stops just below the lows.
The Hunt: Institutions push price below the support level. This triggers thousands of retail Sell Stops.
The Fill: Institutions use this flood of selling to fill their massive Buy orders.
The Rally: Once filled, they push the price back up, leaving retail traders stopped out.
If your pattern failed but the market went in your direction afterward, you were likely a victim of a Liquidity Grab.
3. The Hollow Signal: Why Volume Tells the Real Story
Candlesticks show you Price, but Volume shows you Truth. A major reason for pattern failure is a divergence between “Effort” (Volume) and “Result” (Price).
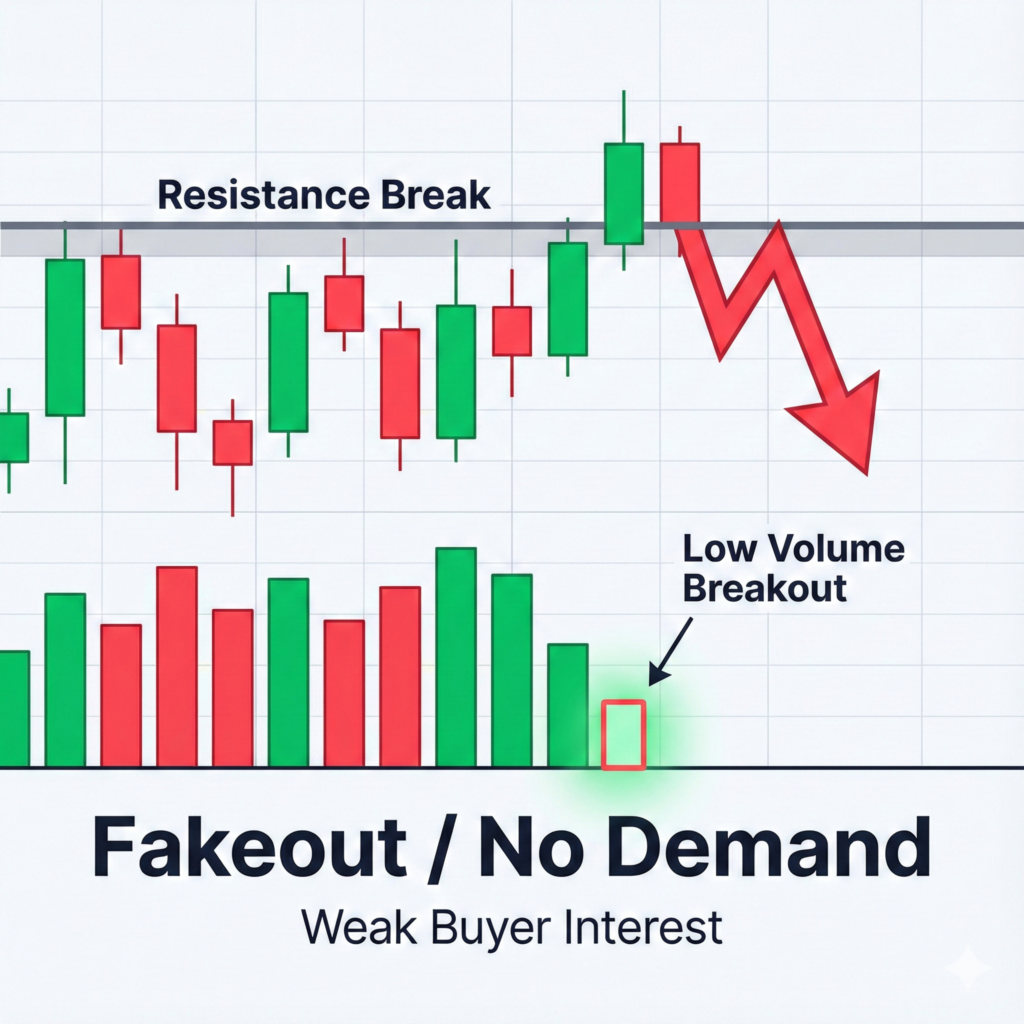
The "No Demand" Trap
Let’s say you see a breakout candle moving above resistance. It looks strong. However, if you look at the volume bars, they are below average. This is a classic “No Demand” scenario.
What it means: The “Smart Money” is not participating in this move. The price is drifting up simply because there are no sellers yet, not because there are aggressive buyers.
The Consequence: As soon as a little supply hits the market, the price will collapse, trapping everyone who bought the breakout.
Pro Tip: In Volume Spread Analysis (VSA), a wide-range green candle with ultra-high volume can sometimes signal a reversal (selling climax), not a breakout. If the next candle is red, that high volume was actually institutions selling into retail buying.
4. The Timeframe Illusion: Are You Zoomed In Too Close?
Modern charting platforms allow us to see price action down to the second. This has created a generation of scalpers obsessed with the 1-minute chart. However, lower timeframes are filled with “market noise.”
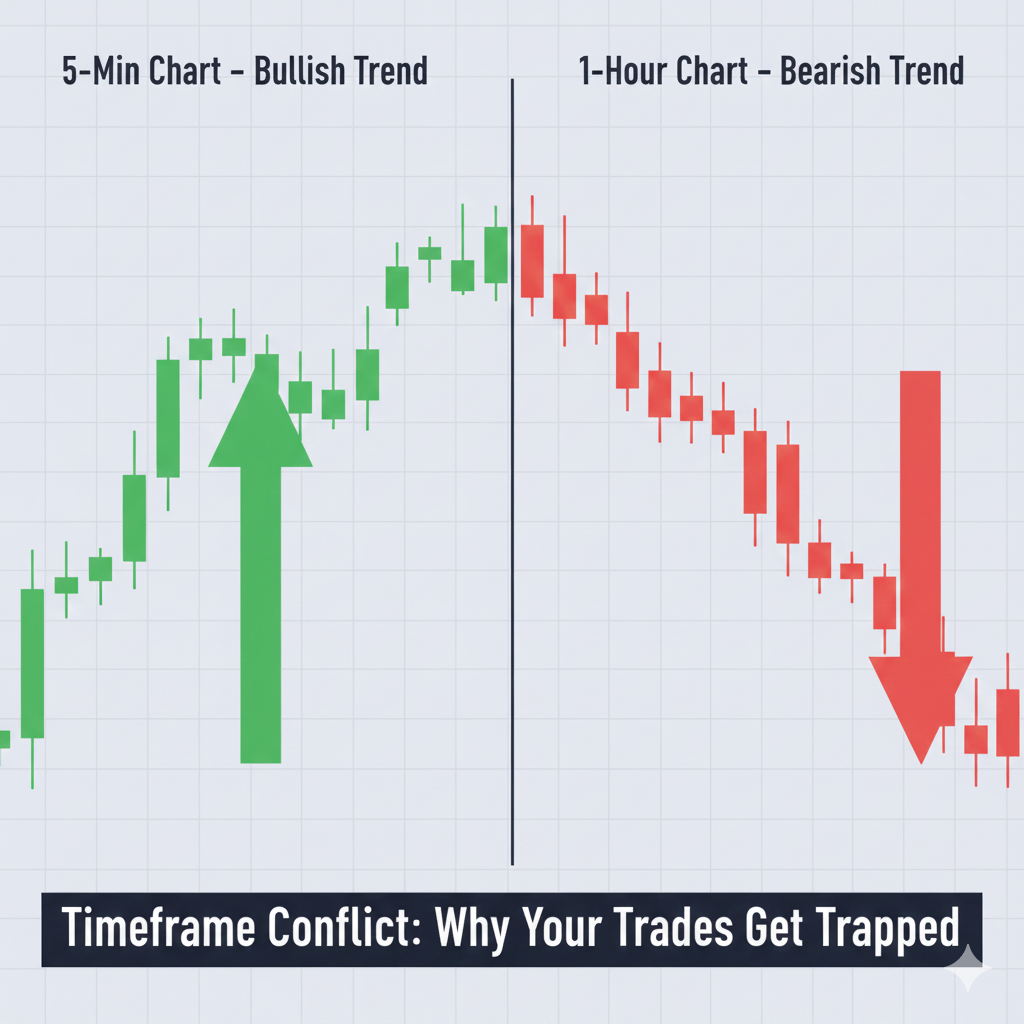
The Fractal Conflict
You might see a perfect “Morning Star” (bullish reversal) on the 5-minute chart. You buy. But if you zoomed out to the 1-hour chart, you would see that the price is actually flagging in a massive downtrend.
The Reality: The 5-minute bullish pattern is just a small pullback in a larger 1-hour bearish move. The higher timeframe always dominates.
The Fix: Use “Multi-Timeframe Alignment.” Never take a 5-minute trade unless the 15-minute or 1-hour structure supports it.
5. The "Amateur Hour" Trap: Time-Based Failures
In the Indian market (IST), time zones play a critical role in volatility. Trading patterns blindly at the wrong time of day is a recipe for disaster.
The “Trap Zone” (11:30 AM – 12:30 PM): Volume typically dries up here. Patterns that form during this lunch hour often fail or drift aimlessly because the big operators are inactive.
The “Euro Shift” (12:30 PM – 1:30 PM): As European markets open, volatility spikes. A pattern that looked good at 12:15 PM might get destroyed by a sudden influx of foreign liquidity at 1:00 PM.
If you are trading breakout patterns during low-volume periods, you are susceptible to “Operator Traps”—where small amounts of capital are used to manipulate price to hunt stops.
6. The Fix: A 5-Step Checklist Before You Click 'Buy'
To stop your candlestick patterns from failing, you need to filter your trades aggressively. Before taking a trade, ask these five questions:
Structure Check: Is the higher timeframe (1-Hour) trend supporting my trade?
Location Check: Is the pattern forming at a key Order Block, CPR level, or Moving Average?
Liquidity Check: Did the market recently “sweep” a high or low? (Buying after a sweep is safer than buying before one).
Volume Check: Is there a spike in volume confirming the pattern?
Buffer Check: Have I added an ATR (Average True Range) buffer to my stop loss to avoid random wicks?
Conclusion
Trading is not about predicting the future; it’s about probability. When you rely solely on visual shapes without considering the underlying market mechanics, you are gambling, not trading. The reason why candlestick patterns fail in live trading is often because they are used as entry signals rather than confirmation signals.
By waiting for the price to reach a key structural location, identifying liquidity grabs, and confirming with volume, you can filter out the noise. Stop trying to catch every move. Wait for the “Smart Money” to show their hand, and then ride their coattails.
Remember: The market is designed to fool the majority. Don’t be the majority.
This is likely a “Liquidity Grab” or “Stop Hunt.” Institutional algorithms target obvious swing lows where retail stop losses are clustered to generate the liquidity needed to fill their large buy orders.
Higher timeframes generally produce more reliable signals. For intraday trading in Nifty/Bank Nifty, using the 15-minute chart for analysis and the 5-minute chart for entry is a balanced approach to filter out noise.
No tool guarantees 100% success, but VSA significantly reduces false positives. It helps you distinguish between a genuine breakout (backed by institutional effort) and a “fakeout” (lack of professional interest).
The Central Pivot Range (CPR) and Moving Averages (like the 200 EMA) are excellent for defining “Location.” Combining these with the ATR indicator for stop-loss placement creates a robust trading system.
The first 15 minutes (9:15–9:30 AM) are highly volatile and prone to “whipsaws.” Beginners should avoid trading patterns during this time as price discovery is still happening; it’s safer to wait for a structure to form after 9:45 AM.
SMC is a method of trading that focuses on supply, demand, and liquidity. It assumes that markets are manipulated by large institutions, and teaches retail traders to identify “Order Blocks” and “Liquidity Pools” to trade alongside these giants.